This is another unit that is generally an exciting and fun unit for students because there is plenty of opportunity to use manipulatives, converse with students, find information (through the use of surveys), and create colourful graphs! The goals of this unit are the following:
1) Use 2 and 3 attributes to sort objects and data
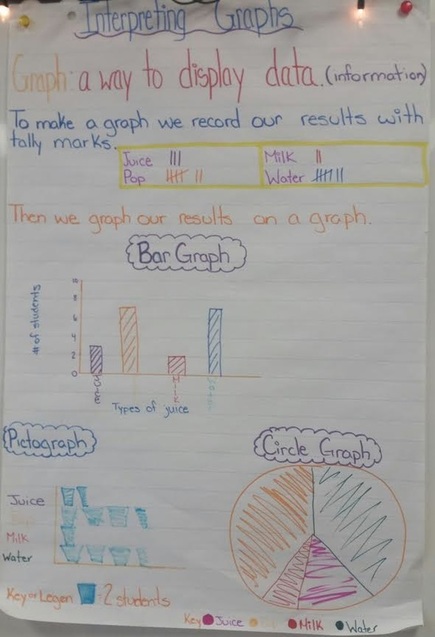
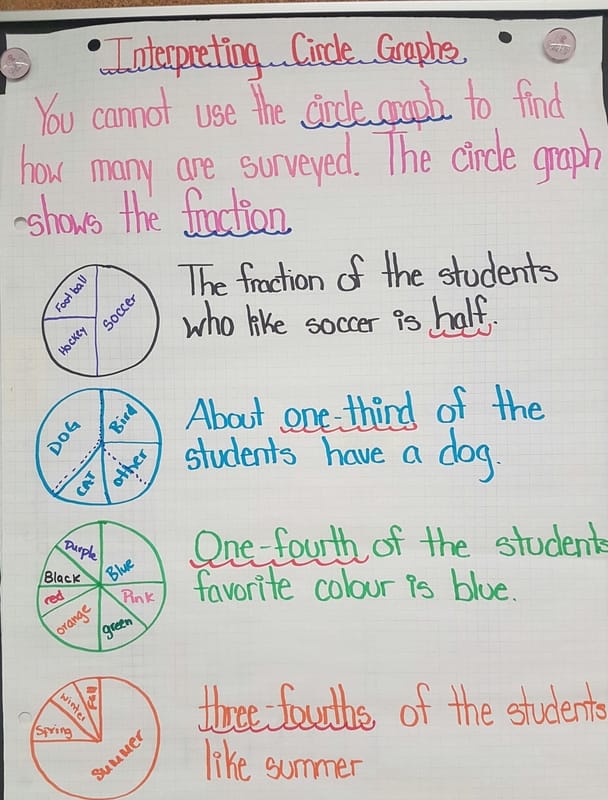
2) Read and find information from pictographs, bar graphs, and circle graphs
3) Draw pictographs and bar graphs (not circle graphs)
4) Collect and organize data
5) Conduct a survey to collect data
6) Display the results of a survey
1) Use 2 and 3 attributes to sort objects and data
2) Read and find information from pictographs, bar graphs, and circle graphs
3) Draw pictographs and bar graphs (not circle graphs)
4) Collect and organize data
5) Conduct a survey to collect data
6) Display the results of a survey
Sorting by two and three attributes
It is important that students understand the following.
An ATTRIBUTE describes an object. An attribute could be colour, shape, size, or any other information that could be used to describe an object. You can sort objects by 2 or 3 attributes. When you decide on attributes you must remember that you can only pick one type of a certain category.
Example: You CAN pick - red, circle, thin - because you have chosen the attributes - colour - shape - size.... BUT YOU CANNOT PICK - red, blue, circle - because you have chosen the attributes - colour- colour - shape.
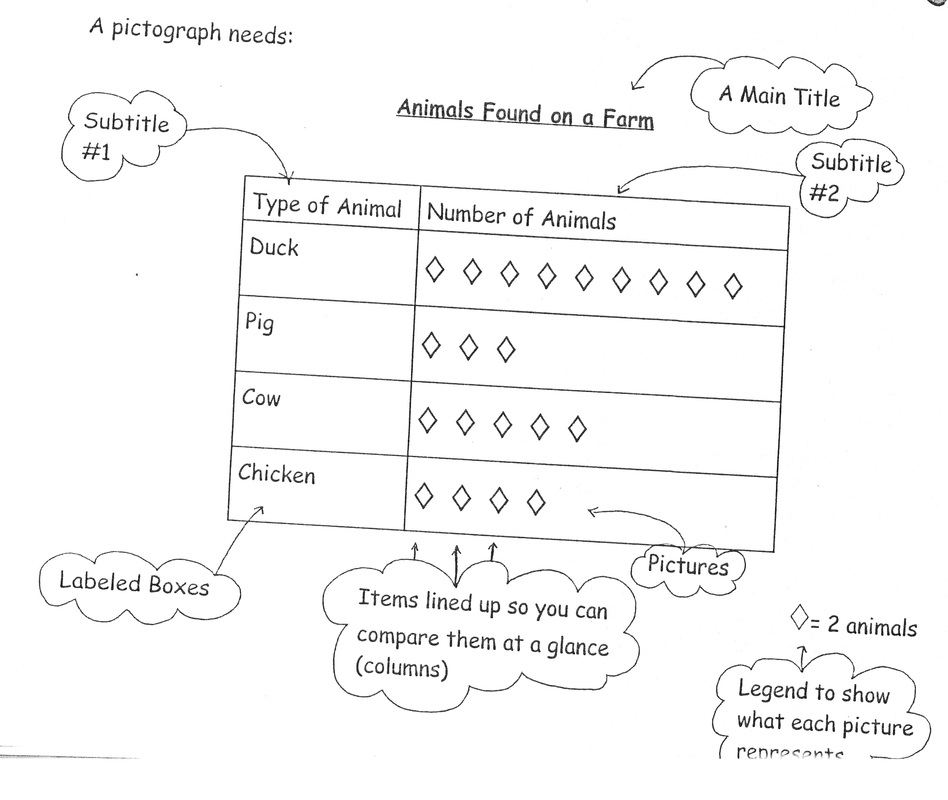
Pictographs
|
|
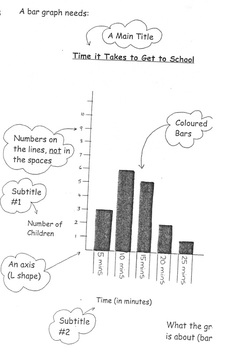
Bar Graph
|
|
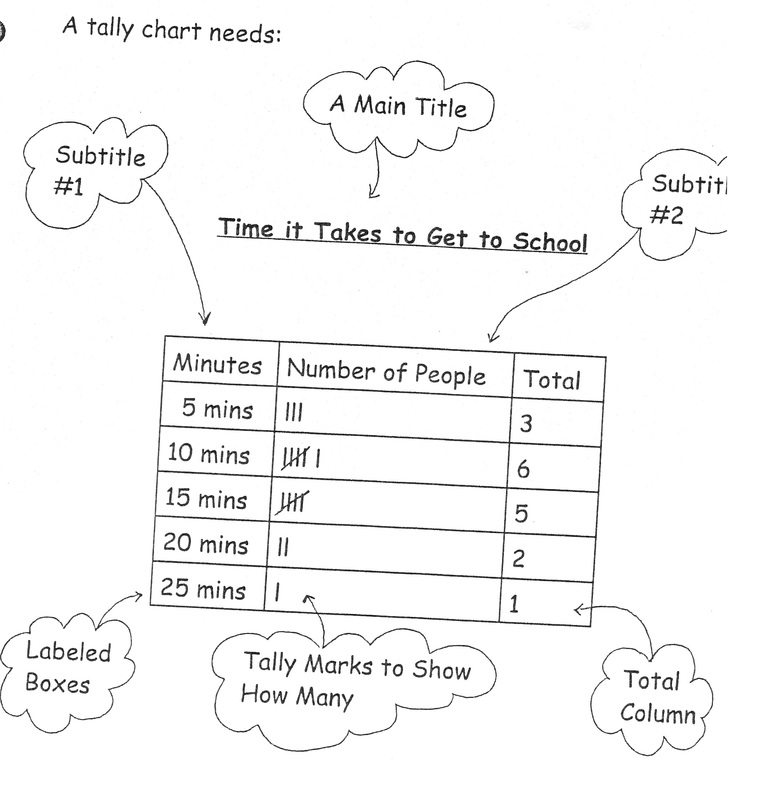
Tally Chart
|
|
|
When reading and finding information on a bar graph or pictograph the grade 3 expectation is that they can critically think and interpret what is displayed on the graphs. Being able to only share what is the highest and what is the lowest is not achieving level 3 standards.
In order to achieve level 3 or 4, students need to compare some of the data they are seeing and how it is all related. Example: Bar 1 is 5 less than Bar 3, Bar 2 and Bar 6 combined equal Bar 3. There are 60 people surveyed in all (by adding up all the bars) |
|
|
|
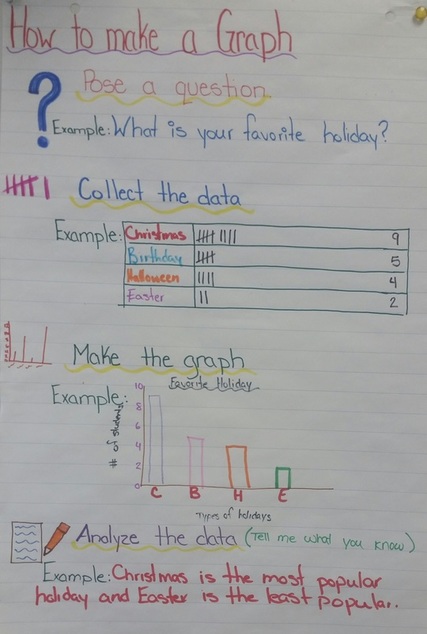
When creating bar graphs, students must remember that all graphs have - a title - labels on the sides (x and y axis) - numbers going up the graph (called a scale - need to decide what the scale will count by. Often a scale should count by an easy number such as 2, 5, or 10) - choices or items along the bottom of the graph to identify what each bar represents - different colours for each bar When creating pictographs, students generally need to remember all the items from above and add, - a key. A key identifies what each symbol on the graph counts for. One symbol might represent the number one, but sometimes the key will state that a symbol can count as 2, or 5, or 10. This means that you would need to skip count for each symbol to reach the total. - a scale is no longer necessary because it has been replaced by a key. |
|
Practicing this sort of interpretation of information at home will be highly beneficial for every student.
